
Fleet telematics: what it is and the KPIs that change operations
The difference between tracking and measuring, the KPIs with their formulas, where each piece of truck data comes from, and where to start without drowning the team in charts.
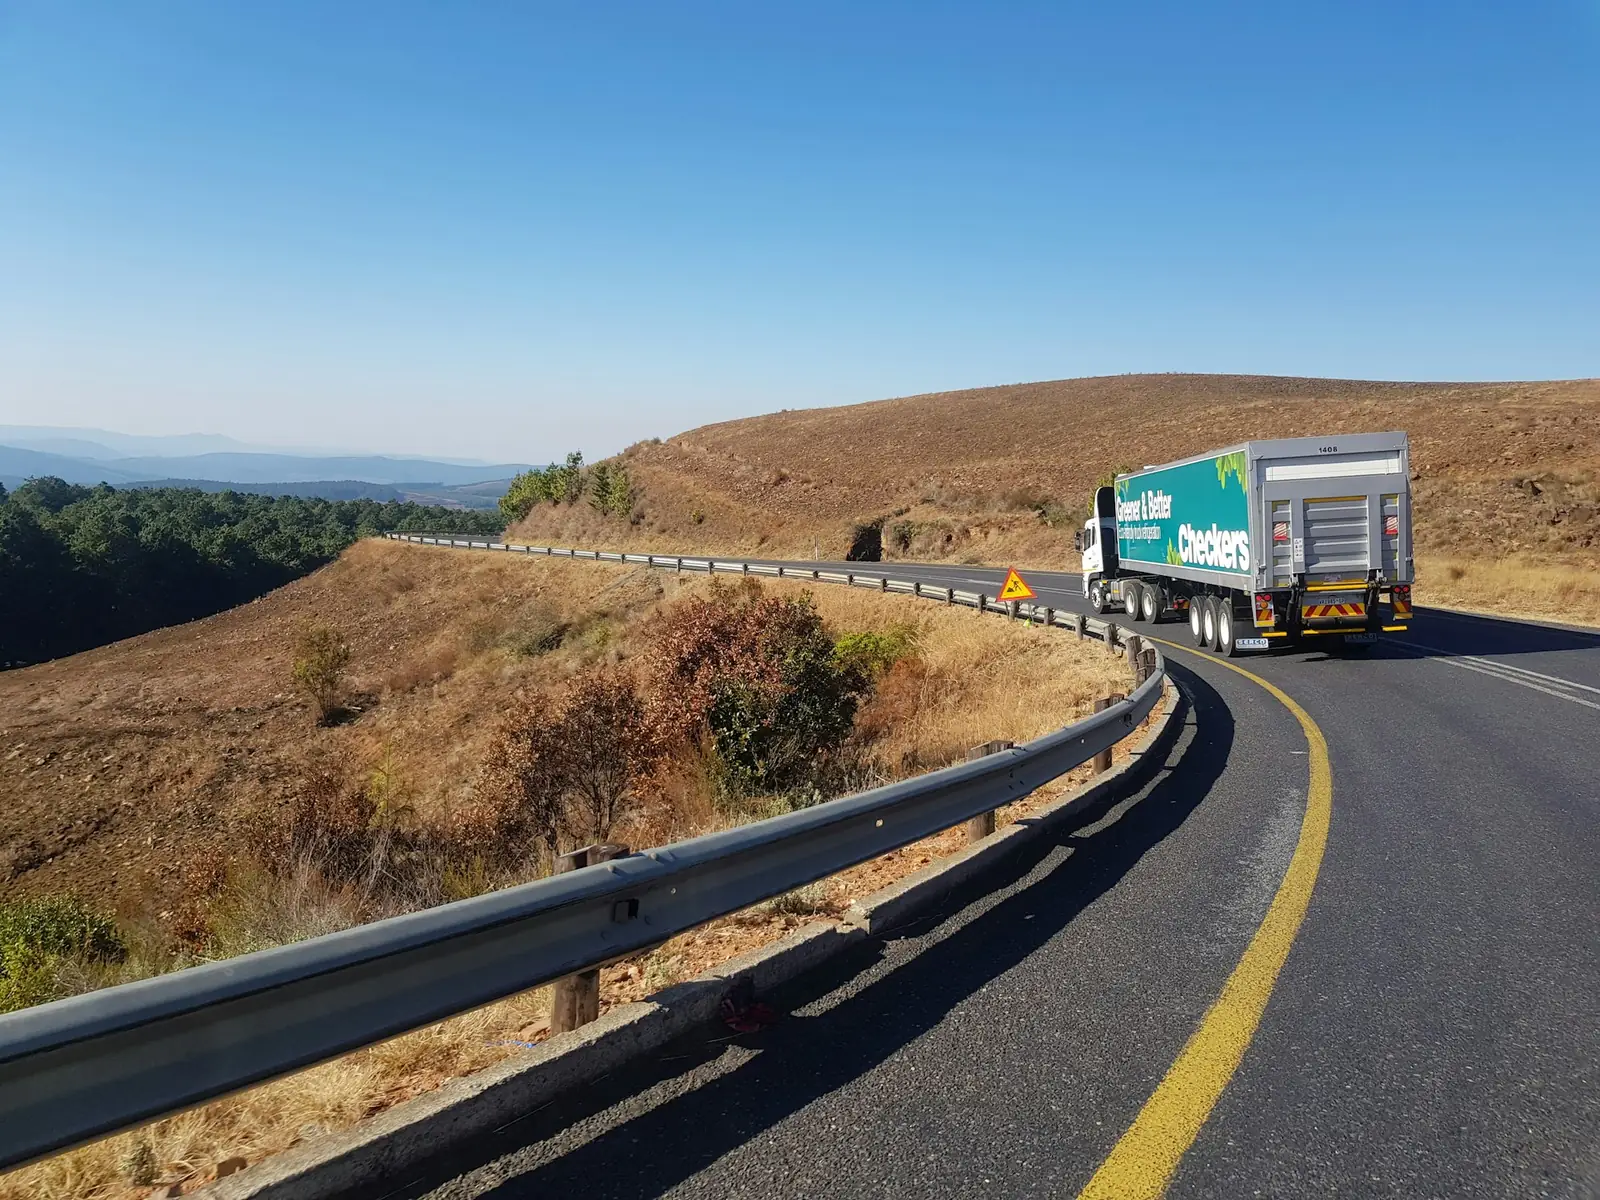
Tracking answers where the vehicle is. Telematics answers how it is being used: engine speed, fuel consumption, road speed, braking, time stopped with the engine running. A fleet can have trackers for years without ever doing telematics, and that is usually where the money nobody sees is hiding.
This article explains where each piece of data comes from, which KPIs are worth the effort and how to get started.
Where the data comes from
- The tracker's GPS: position, route, speed, stops. Every tracker provides this.
- Device inputs: ignition, door, power take-off, a temperature sensor. These depend on the installation.
- The vehicle's internal network: a modern truck has a network (CAN) over which the engine, transmission and instrument cluster talk to each other. European truck manufacturers standardized a read interface for fleet management, the FMS-Standard, which delivers fuel consumption, engine speed, engine hours and other data without workarounds. On vehicles without that interface, what can be read depends on make and model year.
The deeper the data, the more the KPI is worth and the more the installation matters.
The KPIs that change operations
Fuel economy (km/L). Kilometers driven divided by liters fueled, per vehicle and per driver. It is the foundation of everything, and it usually reveals large differences between drivers on the same route.
Idling. Time with the engine on and the vehicle stopped, divided by total engine-on time. An engine idling burns fuel and racks up maintenance hours without moving an inch.
Speeding. Time spent, or number of events, above the road's speed limit or the company's own rule. It weighs on fuel consumption, wear and risk.
Harsh braking and acceleration. Events per 100 km. It is the driving KPI most closely tied to tires, brakes and accidents.
Time at customer. From arrival to departure at each geofence. It shows where the fleet loses hours waiting, and it backs up detention charges.
Availability. Days or hours in which the vehicle was fit to run, over the total. It separates a maintenance problem from a scheduling problem.
Cost per kilometer. Fuel, maintenance, tires, tolls and fixed costs added together, divided by kilometers. It is the number finance understands and the one that justifies everything else.
Where to start
The most common mistake is turning on fifty charts on day one. Nobody looks at them, and the project dies from lack of use. An approach that works:
- Pick three KPIs tied to a concrete pain point. If fuel is your biggest cost: fuel economy, idling and speeding.
- Measure for a month without changing anything. That is your baseline; without it, no improvement can be proven.
- Set a target and a conversation. A KPI only changes behavior when someone talks to the driver about it, with the data in hand.
- Only then add the next KPI.
Telematics and the driver
Telematics is not automatic punishment. The data shows a pattern, and patterns are corrected with training, a better route or a scheduling adjustment. A fleet that uses the KPI only to fine drivers loses its good drivers and keeps the ones who learn to fool the sensor. The same logic applies to in-cab cameras; see video telematics.
Where IoTData fits in
Position, speed, engine hours and device inputs reach the platform over the cellular network or the DG satellite network, with geofences and alerts by email and WhatsApp. Reading the vehicle's internal network is defined during the survey, according to the fleet. See satellite tracker and fleet management.
Sources: FMS-Standard (fleet management data interface of the European commercial vehicle manufacturers); common definitions of fleet management KPIs.