iotdata, by Data Frontieriot
data
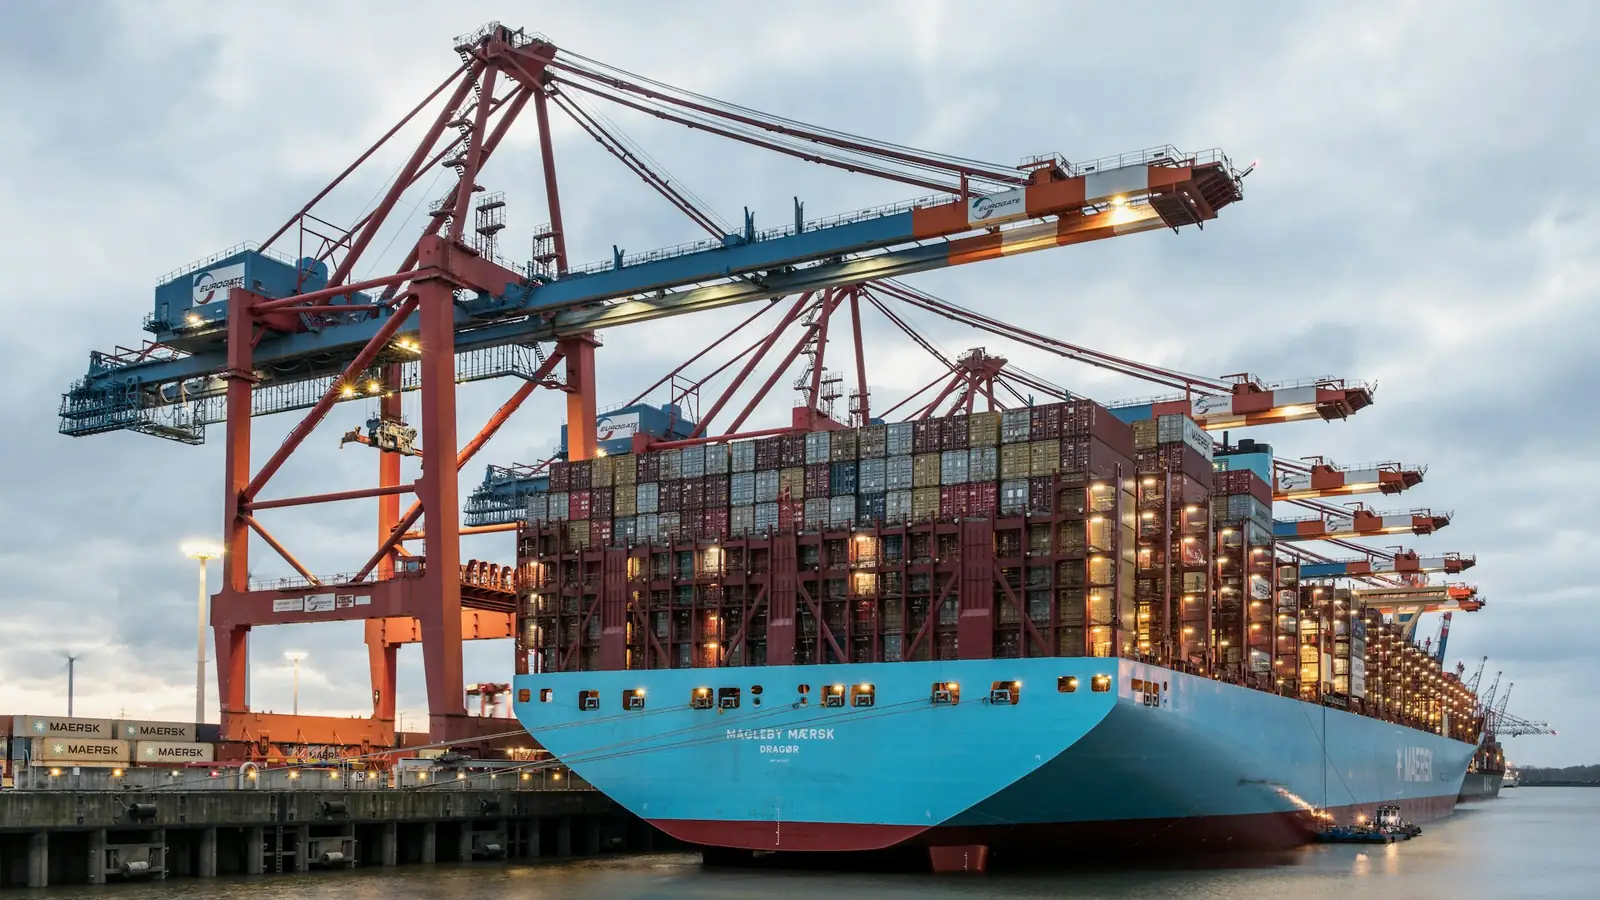
Container ship berthed under the terminal’s cranes
Ports, terminals and inland ports

At the terminal, the loss is the container that warmed up and the truck that waited.

Monitoring of refrigerated containers at the plug, tracking and engine hours of reach stackers and terminal tractors, a weather station for wind and rain, and the time of every truck between the gate and the quay. For seaports, port-side terminals and inland ports, with the platform and engineering by Data Frontier, Brazil.

  • What goes on the dashboard
  • Temperature and power of every plugged-in reefer
  • Position and engine hours of yard equipment
  • Wind and rain at the point of operation
  • Arrival, waiting and departure of every truck
What weighs on the terminal

Three facts of port operations.

Cargo that loses temperature, trucks that wait and cranes that stop for wind. All three can be measured, and all three turn into money.

Refrigerated container
Reefer

A reefer has its own refrigeration unit and depends on the plug in the yard. Unplugged to move to another stack, or with a loose plug, it warms up in silence. Temperature and power measured on every container replace the damage survey with an alert before the loss.

Monitoring per container, at the plug or on the unit itself
Gate
Turn time

Truck turn time, from gate-in to gate-out, is how terminals and truckers measure congestion at the gate. Geofences at the gate, the staging area and the quay show where each truck waited, for how long and at which step.

Measured by geofence: gate-in, staging, quay and gate-out
Wind
Gusts

Every quay and yard crane has a maximum operating wind speed set by its manufacturer, and it is the gusts that trip it. A weather station at the point of operation gives the warning in time and keeps the record that justifies the stoppage.

Limits from each crane’s manufacturer and the terminal’s procedures
What we measure

From the reefer plug to the gate.

Every container, every machine and every truck with time, place and status, and the alert going to whoever is on duty.

Plugged-in reefers

Reading from the refrigeration unit’s controller, with temperature, setpoint and alarm, plus power at the plug. A container without power or out of range becomes an alert for the duty team.

Yard equipment

Reach stackers, forklifts and terminal tractors with position, engine hours and geofences. Usage-based maintenance and the real utilization of each machine.

Gate and waiting time

Geofences at the entrance, the staging area and the quay. How long each truck waited, where and at which step.

Wind and rain

A weather station at the terminal: wind for crane operations, rain for bulk cargo that cannot get wet, and a history to justify the stoppage.

Pedestrians and machines

A camera with pedestrian detection on the forklift and the reach stacker, the same one used in IoT Safety.

Shock and damage logger

It goes inside the container or the box and logs position, temperature and impact from the port to the destination. Transport damage stops being one word against another, and the data flows by API to the terminal system.

Dashboard exampleA night shift in the yard, on the dashboard
  1. 22:10Reefer in block C, stack 4: no power at the plug Alert
  2. 22:12Alert sent to the duty team on WhatsApp Cellular
  3. 22:31Power restored; temperature returning to range Cellular
  4. 23:05Wind gust above the crane limit Alert
  5. 23:40Truck left the gate: 6 h 15 min between arrival and departure Log

Illustrative example. Limits and recipients for each alert are configured with the terminal.

How deployment works

Four steps, with one person accountable from start to finish.

  1. 01

    Survey

    How many reefer plugs, which yard equipment, where the gate is, what the terminal system already records and what is missing.

  2. 02

    Pilot

    One reefer block and a few machines, with the data compared against your current records for a month.

  3. 03

    Rollout

    The whole yard, the weather station and the gate geofences, with the dashboard and the duty alerts.

  4. 04

    Operation

    Support from the team that installed it and a review of alert limits with the operation.

We are honest about what is ours. The reefer’s refrigeration unit belongs to its manufacturer, and the terminal operating system belongs to whoever already runs it. The reefer controller reading, the sensors and the damage logger are manufactured by us: we measure what the terminal does not see in one place, bring it to one dashboard and alert the right person. In the yard over the cellular network, and on the road with no tower over the DG satellite network, the data arrives in minutes.

Frequently asked questions

The usual questions, answered plainly.

Do you monitor the reefer during the sea voyage?

Our focus is the yard, the inland port and the road. On board, the reefer is connected to the ship’s power, and onboard data belongs to the shipping line. On the road inland, monitoring continues over cellular or the DG satellite network, in minutes.

Does it work at an inland port or dry port?

The same way: reefer plugs, yard equipment, gate and weather station. An inland terminal has the same blind spots as a seaport, just farther from the sea.

Does the weather station replace official forecasts?

No. It measures wind, rain and temperature at the exact point of operation, with history, which is what a crane stoppage and a delay justification need.

Does it integrate with the terminal operating system?

Yes, by REST API. The scope is defined in the survey, with the terminal’s IT team.

Request a proposal

Tell us the size of the yard and what hurts most.

An answer from an engineer, not a bot. Tell us how many reefer plugs and which equipment the terminal has.

Used only to reply to this request. No newsletter. Privacy policy.
Other areas

The same hardware and the same dashboard, in other sectors.