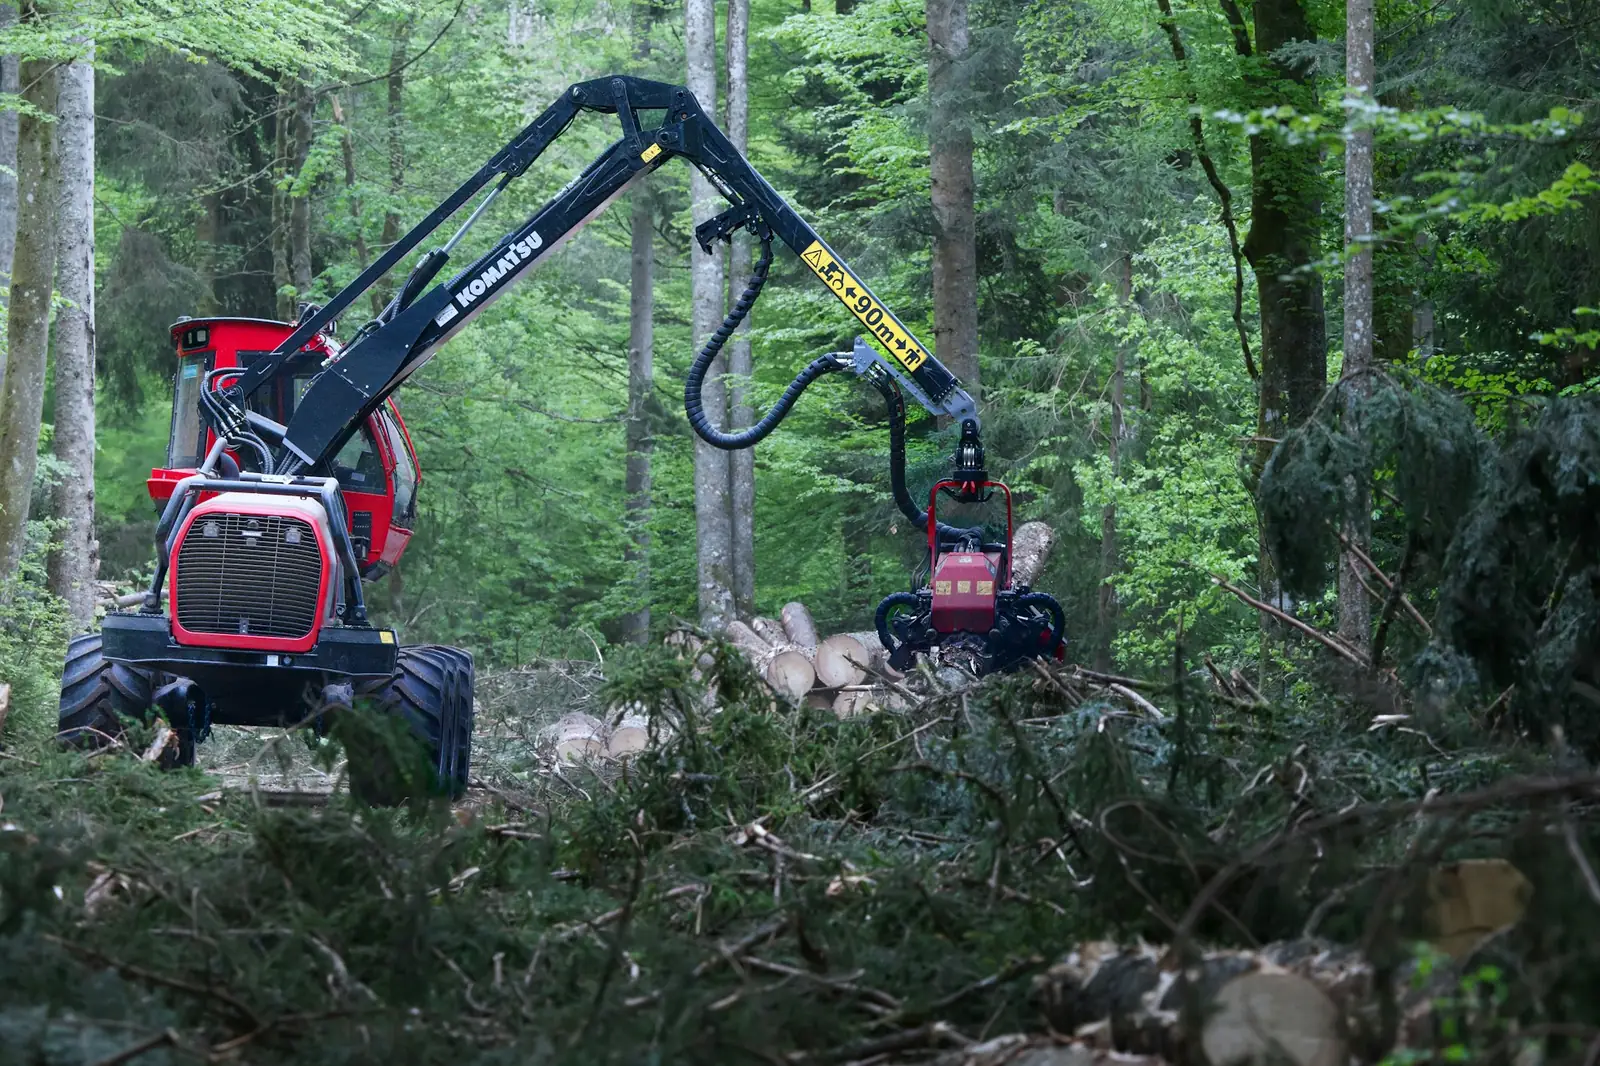
The harvester’s on-board computer records production in the StanForD 2010 standard, maintained by the Swedish forestry research institute Skogforsk and adopted by the major manufacturers. The data exists; the bottleneck is bringing it from the woods to the office.
Three facts of mechanized harvesting.
The machine already produces data. What is missing is getting that data out of the harvesting site the same day and turning it into a KPI without anyone typing.
Mechanical availability is the share of time the machine was fit to work. Calculated from hours read from the machine, it stops being the optimistic average on the timesheet and starts pointing at which machine and which fault hold the crew back.
Short logs, with harvester and forwarder inside the stand, or whole trees, with feller buncher and skidder and processing at the roadside. What to measure changes with the system, and the telematics is designed for yours.
From the cutting face to the mill yard.
Every machine and every truck becomes a line on the dashboard, with time, place and status. The KPI comes out on its own at the end of the shift.
Engine and working hours
Hour meter read from the machine or from one of our sensors, separating engine on from machine working when the equipment provides the signal.
Availability and efficiency
Mechanical availability, utilization rate and operational efficiency per machine, shift and crew, with the same formula every day.
Stops and maintenance
Stops with time and place, classified by the operator with a button or by maintenance on the dashboard. The history shows the fault that holds the crew back the most.
Log hauling
Truck position and cycle: queue at loading, travel time and queue at the mill. It is where harvesting meets logistics.
Data out of the woods
Where there is no tower, the event goes up over the DG satellite network in minutes, just as over the cell tower. Stops and end of shift show up on the dashboard without anyone going to fetch them.
Integration
REST API for your forest planning system or ERP. Reading each brand’s production file is assessed in the survey.
- 06:02Harvester H-07: engine on in stand 31 Satellite
- 09:47Stop: hydraulic hose, location logged Alert
- 11:15Back to work: 1 h 28 min under maintenance Satellite
- 17:58End of shift: 11 h 56 min engine, 9 h 20 min working Satellite
- 18:00Daily availability for crew 3: 87% Log
Illustrative example. Over the DG satellite network, each event reaches the dashboard in minutes, stamped with the time it happened.
Four steps, with one person accountable from start to finish.
- 01
Survey
Harvesting system, makes and age of the machines, what the on-board computer already records, where there is signal and how machine hours are logged today.
- 02
Pilot
One crew equipped, with the KPI calculated side by side with the current timesheet for a month. It only moves forward if the numbers add up.
- 03
Rollout
The remaining crews, log hauling and the dashboard per crew and per machine, with alerts configured.
- 04
Operation
Support from the team that installed it and a monthly KPI review with the harvesting and maintenance teams.
We are honest about what is ours. The harvester and its on-board computer belong to the manufacturer, and so does the production file. What we do is bring the data out of the woods and turn hours and stops into KPIs. Reading each brand’s production file is an integration assessed in the survey, not a promise on a web page. And over the DG satellite network, the event arrives in minutes, even from the most isolated site.
The usual questions, answered plainly.
Does it work with any make of harvester?
Hours, position and stops work on any machine, with our own sensor when the machine does not provide the signal. Reading the on-board computer’s internal data depends on the make and model, and is assessed in the survey.
How long does the data take to arrive?
Minutes, with or without cellular signal: where there is a tower, through the carrier; at a harvesting site with no signal, over the DG satellite network. Each event carries the time it happened, and the shift KPI closes on its own.
Does the operator have to do anything?
The minimum: classify the stop, with a button or on the dashboard. Hours, position and start and end of shift come out on their own.
Does it work for harvesting contractors?
Yes, and it helps both sides: the contractor proves the machine’s availability and the forest company pays based on data.
Tell us how many crews you run and which machines they use.
An answer from an engineer, not a bot. Tell us the makes and how machine hours are logged today.
The same hardware and the same dashboard, in other sectors.
References: StanForD 2010 (Skogforsk) · definitions of mechanical availability, utilization rate and operational efficiency from the forest harvesting literature.