
Mechanical availability and operational efficiency: the numbers behind forest harvesting
Mechanical availability, utilization rate and operational efficiency with formulas and a worked example, and why the hand-filled shift report almost always errs on the high side.
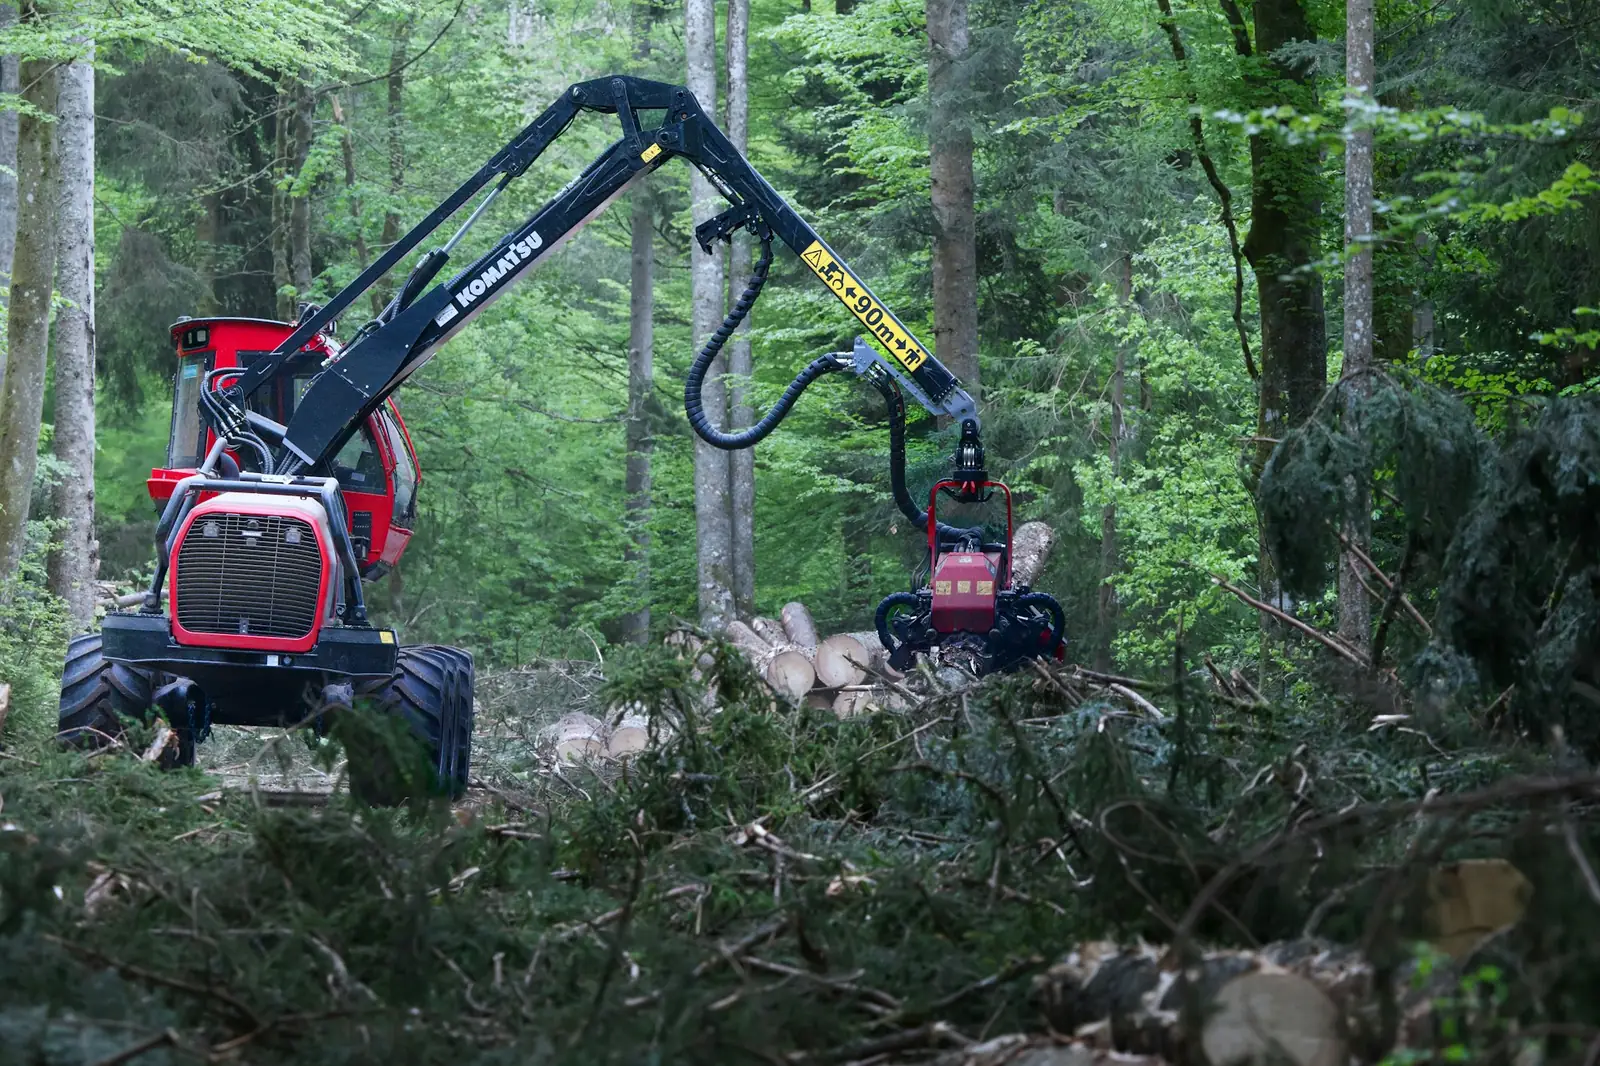
Every forest harvesting meeting comes down to three numbers: mechanical availability, utilization rate and operational efficiency. They determine how much the front produces, how much the contractor gets paid and where maintenance needs to step in. This article gives the formulas, a worked example and the most common mistakes.
The hours that go into the calculation
It all starts by splitting the shift into pieces:
- TH, total hours: the time scheduled for the machine in the period, for example the shift.
- MH, maintenance hours: the time the machine was down because of itself: breakdowns, corrective and preventive maintenance during the shift.
- EH, effective hours: the time the machine actually worked.
- What is left, TH − MH − EH, is operational downtime: no stand ready to cut, waiting for a truck, shift change, meals, rain, travel.
The three formulas
Mechanical availability (MA): how much of the time the machine was fit to work.
MA = (TH − MH) ÷ TH × 100
Utilization rate (UR): of the time it was fit to work, how much was used.
UR = EH ÷ (TH − MH) × 100
Operational efficiency (OE): of the total time, how much turned into work.
OE = EH ÷ TH × 100 = MA × UR
The beauty of this breakdown is in the last equation: if efficiency dropped, the math tells you whether it was the machine (low MA, a maintenance problem) or the operation (low UR, a problem with planning, stand availability or logistics).
An example
A harvester on a 9-hour shift:
- TH = 9.0 h
- MH = 1.5 h (a hydraulic hose and re-tightening the head)
- EH = 6.3 h
Then:
- MA = (9.0 − 1.5) ÷ 9.0 = 83.3%
- UR = 6.3 ÷ 7.5 = 84.0%
- OE = 6.3 ÷ 9.0 = 70.0%, which is 83.3% × 84.0%
Of the 2.7 hours lost, 1.5 were due to the machine and 1.2 to the operation. Those are two different conversations, with two different teams.
Why the hand-filled report gets it wrong
- Rounding. A 20-minute stop becomes "nothing" or "half an hour", depending on the day.
- End-of-shift memory. The operator fills everything in at six in the evening, and the short stops disappear.
- Engine running is not work. A machine idling while it waits for a truck goes down as worked hours, and the UR comes out inflated.
- Self-interest. Under an availability-based contract, the person filling out the report is the one getting paid. Nobody has to lie for the number to come out optimistic.
The result is predictable: MA and OE on paper are almost always higher than reality, and the front that "has 90% availability" produces as if it had 75%.
How to measure without a paper report
- Engine hours read from the machine, not written down.
- A work signal, when the machine provides one (hydraulic pressure, head activation), to separate an engine that is running from a machine that is producing.
- Stops classified as they happen, with a button in the cab or by maintenance on the dashboard: mechanical, operational, weather, no stand ready.
- Automatic calculation by machine, shift and front, with the same formula every day.
Where IoTData fits in
Engine hours, stops and position from every machine reach the platform and become MA, UR and OE per shift. On a front without cell signal, the data goes up over the DG satellite network in minutes, and the daily report closes without anyone having to go out and fetch it. See telemetry for forest harvesting.
Sources: definitions of mechanical availability, utilization rate and operational efficiency used in the Brazilian forest harvesting and transport literature.